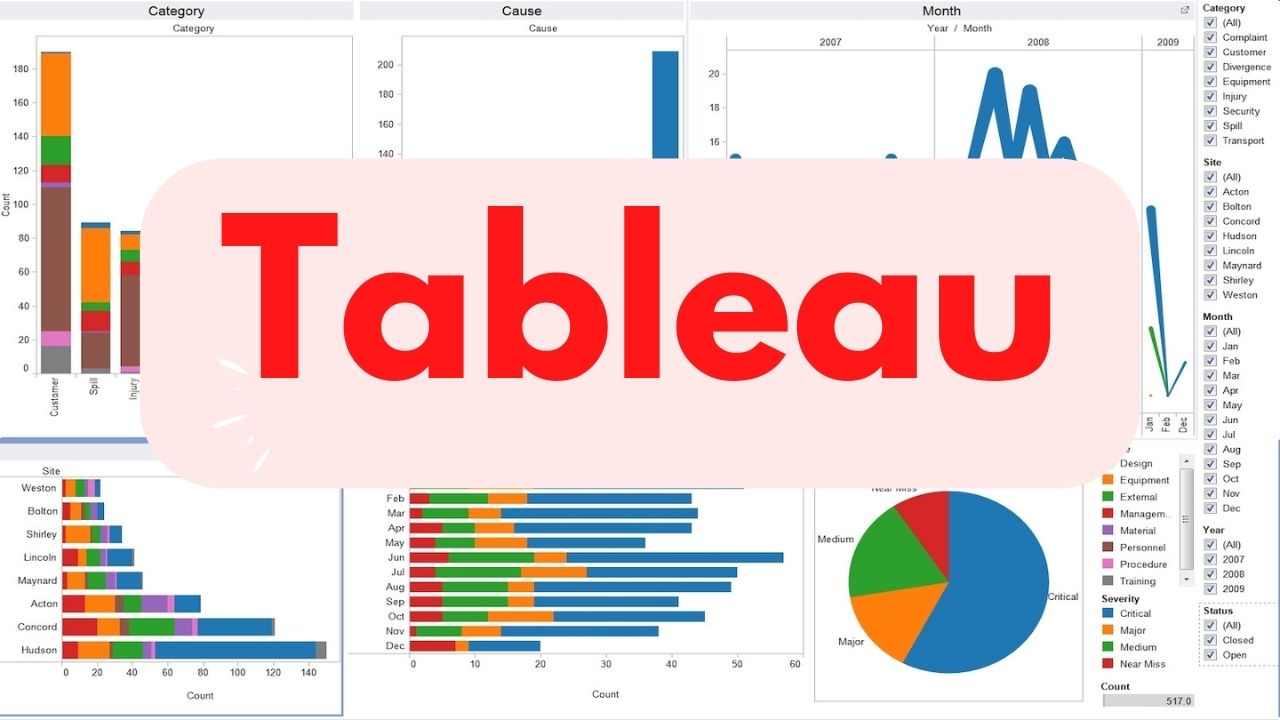
Tableau Course#
A brief summary of the topics covered in this Tableau course is as below. This is 16 hours course, it is suggested to complete this course in 1 week.
Basic Visualization using Tableau#
- Introduction to Tableau
- Introduction to UI Interface
- What is Data Analytics?
- Why Data Visualization?
- Why Tableau?
- Tableau vs Excel and Power BI
- Exploratory vs Explanatory Analysis
- Getting Started with Tableau
Introduction and installation#
- Dashboarding & storytelling using Tableau
- Talking about Business Intelligence
- Tools and Methodologies used in BI
- Why Visualization is getting more popular
- Tableau Products
- Tableau Architecture
- BI Project Execution
- Tableau Installation in local system
- Introduction to Tableau Prep
- Tableau Prep Builder User Interface
- Data Preparation techniques using Tableau Prep Builder tool
- How to connect Tableau with different data source
Visualizing and Analyzing Data with Tableau#
- Introduction
- Bar Charts
- Line Charts and Filters
- Area Charts
- Box Plots and Pivoting
- Maps and Hierarchies
- Pie Charts
- Treemaps and Grouping
- Dashboards – I
- Visual Segments
- Visual Analytics in depth
- Filters, Parameters & Sets
- Tableau Calculations using functions
- Tableau Joins
- Working with multiple data source (Data Blending)
- Building Predictive Models
- Dynamic Dashboards and Stories
- Sharing your Reports
- Tableau Server
- User Security
- Scheduling
- Joins and Splits
- Numeric and String Functions
- Logical and Date Functions
- Histograms and Parameters
- Scatter Plots
- Dual Axis Charts
- Top N Parameters and Calculated Fields
- Stacked Bar Charts
- Dashboards – II and Filter Actions
- Storytelling
- Batting Performance Analysis
- Additional Reading
- Connecting to MySQL Workbench
LOD (Level of Details)#
Data Mining With Tableau#
- Get the Dataset + Project Overview
- Connecting Tableau to an Excel File
- How to visualize an ad-hoc A-B test in Tableau
- Working with Aliases
- Adding a Reference Line
- Looking for anomalies
- Handy trick to validate your approach / data
- Creating bins & Visualizing distributions
- Creating a classification test for a numeric variable
- Combining two charts and working with them in Tableau
- Validating Tableau Data Mining with a Chi-Squared test
- Chi-Squared test when there is more than 2 categories
- Visualising Balance and Estimated Salary distribution
- Chi-Squared Test
- Section Recap
Data Storytelling#
- Introduction to Data Storytelling
- Introduction to the Module
- Pre-Read Assignment
- What is Data Storytelling?
- Importance of Data Storytelling
- Characteristics of a Good Story with Data
- What Makes Data Storytelling Difficult?
Components of a Good Story with Data#
- Essential Components of a Good Story with Data
- Importance of Objective and Agenda
- Five Patterns of Insights
- Analysis Approach: Deriving New Columns
- Analysis Approach: Summarizing Rows
- Insight Overview
- Structure and Flow
- Pyramid Principle
- Visuals
- Importance of Visualization
- Visualization of Quantitative Data
- Visualization of Qualitative Variables
- Visualization of Other Types of Information
- Visualization of Advanced Analytical Techniques
Golden Rules for an Effective Data Storytelling#
- Introduction
- Visual Design Principles and Storyboarding
- Best Practices for Data Storytelling
- Ideal Solution for the Home Loans Case Study


Comments: