
The data points below are related to Software Development State of Art in America. You can imagine what may be happening in other part of the world.
- United States spends more than $250 billion each year on IT application development of approximately 175,000 projects
- 31.1% of projects will be canceled before they ever get completed.
- 52.7% of projects will cost 189% of their original estimates.
- The lost opportunity costs are not measurable, but could easily be in the trillions of dollars.
- The failure to produce reliable software to handle baggage at the new Denver airport is costing the city $1.1 million per day.
- On average only 16.2% for software projects that are completed on time and on-budget
- In the larger companies, the news is even worse: only 9% of their projects come in on-time and on-budget
- Projects completed by the largest American companies have only approximately 42% of the originally-proposed features and functions.
- Projects completed by the smaller American companies A total of 78.4% of their software projects will get deployed with at least 74.2% of their original features and functions.
- 48% of the IT executives in the research sample feel that there are more failures currently than just five years ago
- Time overrun: The average overrun is 222% of the original time estimate. For large companies, the average is 230%; for medium companies, the average is 202%; and for small companies, the average is 239%.
- Cost overrun: The average across all companies is 189% of the original cost estimate. The average cost overrun is 178% for large companies, 182% for medium companies, and 214% for small companies.
- Features and functions: On average, only 61% of originally specified features and functions were available on these projects. Large companies have the worst record with only 42% of the features and functions in the end product. For medium companies, the percentage is 65%. And for small companies, the percentage is 74%.
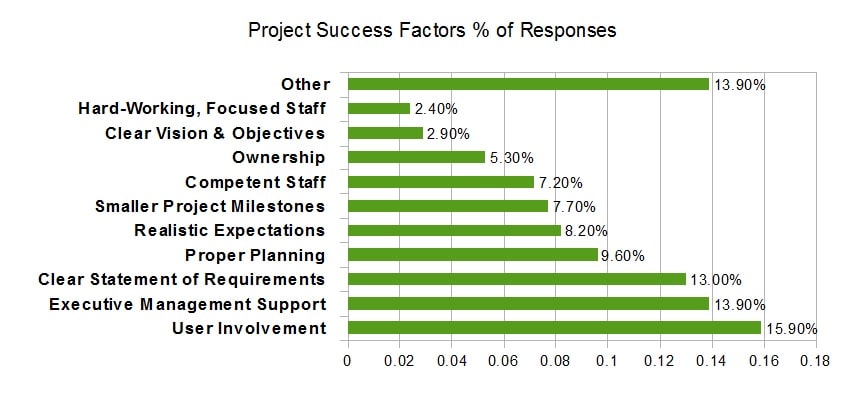
4 Projects were taken for the case study and out of these the HYATT project had the highest points for success criteria and was complete on time, in budget with more features.
4 Projects of Case Study
| Success Criteria | Points | DMV | CONFIRM | HYATT | ITAMARATI |
|---|---|---|---|---|---|
| 1. User Involvement | 19 | NO(0) | NO(0) | YES(19) | YES(19) |
| 2. Executive Management Support | 16 | NO(0) | YES(16) | YES(16) | YES(16) |
| 3. Clear Statement of Requirements | 15 | NO(0) | NO(0) | YES(15) | NO(0) |
| 4. Proper Planning | 11 | NO(0) | NO(0) | YES(11) | YES(11) |
| 5. Realistic Expectations | 10 | YES(10) | YES(10) | YES(10) | YES(10) |
| 6. Smaller Project Milestones | 9 | NO(0) | NO(0) | YES(9) | YES(9) |
| 7. Competent Staff | 8 | NO(0) | NO(0) | YES(8) | YES(8) |
| 8. Ownership | 6 | NO(0) | NO(0) | YES(6) | YES(6) |
| 9. Clear Vision & Objectives | 3 | NO(0) | NO(0) | YES(3) | YES(3) |
| 10. Hard-Working, Focused Staff | 3 | NO(0) | YES(3) | YES(3) | YES(3) |
| TOTAL | 100 | 10 | 29 | 100 | 85 |
Compete Chaos Report can be read at here (source link) or here (local link)

Comments: