
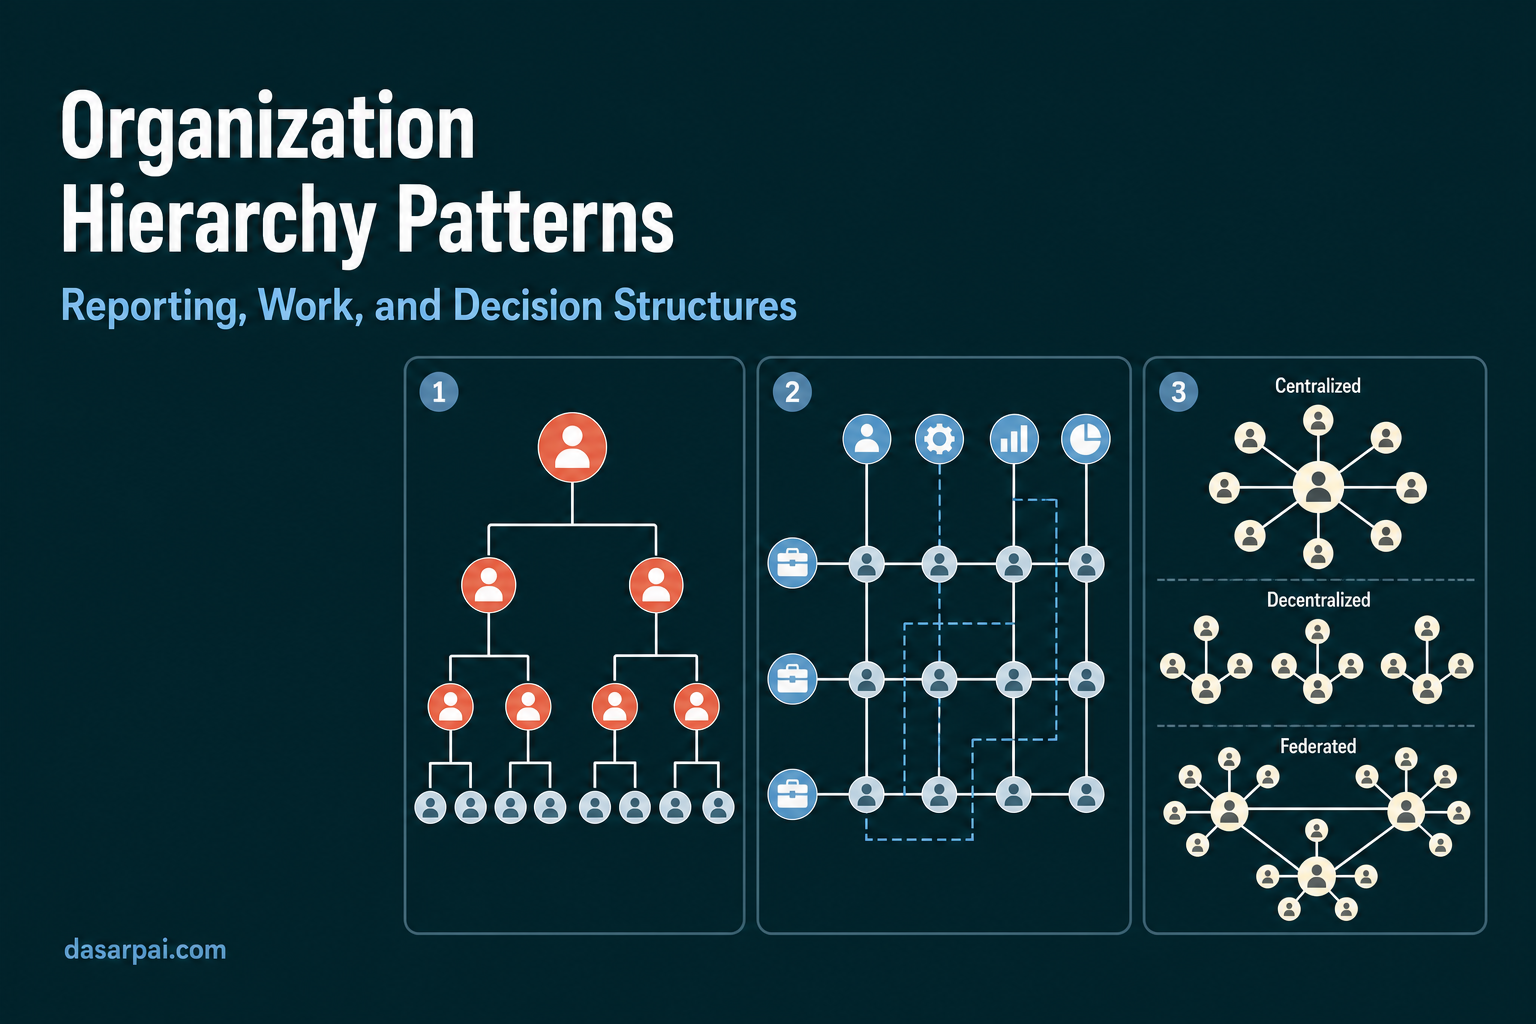
Organization Hierarchy Patterns#
1. Why Organization Structure Matters#
An organization is not only a group of people. It is a system of responsibility, authority, communication, decision-making, and execution.
When we look at an organization chart, we usually ask a simple question:
Who reports to whom?
But this question is not enough.
In modern organizations, reporting, work direction, and decision-making may not always follow the same line. A person may formally report to one manager, take project direction from another manager, receive technical guidance from an architect, and work with multiple cross-functional teams.
Therefore, instead of seeing organization structure as only a “hierarchy chart,” we should study it from three angles:
- Reporting structure — who is officially responsible for whom?
- Work structure — how does actual work get done?
- Decision structure — where are important decisions made?
A real organization is usually a combination of all three.
2. One Master Diagram: Three Ways to Understand an Organization#
This diagram is the foundation of the article.
It tells us that an organization can be hierarchical in reporting, matrix-based in execution, and centralized in decision-making at the same time.
3. Basic Vocabulary#
Before discussing organization patterns, a few terms must be clear.
3.1 Formal Manager#
A formal manager is the official reporting manager. This person is usually responsible for performance review, career growth, leave approval, compensation input, and accountability.
3.2 Work Manager#
A work manager may not be the official reporting manager. This person may guide day-to-day work in a project, product, client engagement, or program.
3.3 Span of Control#
Span of control means the number of people directly reporting to one manager.
A manager with 5 direct reports has a narrow span of control. A manager with 50 direct reports has a wide span of control.
3.4 Centralization#
Centralization means important decisions are made by a small number of senior leaders.
Decentralization means teams, departments, or business units have more freedom to make decisions.
3.5 Matrix#
A matrix structure means a person may have one formal manager but may also receive project or product direction from another leader.
Part A: Reporting Structure#
Reporting structure answers the question:
Who officially reports to whom?
4. Single-Manager Hierarchy#
This is the most familiar organization structure. Every person has one official manager. Authority flows from top to bottom.
4.1 Balanced Hierarchy#
In a balanced hierarchy, managers at the same level have almost similar team sizes.
Example:
- Manager A has 8 people.
- Manager B has 9 people.
- Manager C has 7 people.
This structure is simple and clean.
4.2 Uneven Hierarchy#
In an uneven hierarchy, the reporting line is still clear, but team sizes are different.
Example:
- Sales manager has 80 people.
- Legal manager has 6 people.
- Architecture manager has 10 people.
This is common because different functions require different team sizes.
Strength#
Single-manager hierarchy gives clarity. Everyone knows their manager.
Risk#
It can become slow, rigid, and too dependent on the chain of command.
5. Functional Organization#
In a functional organization, people are grouped by specialization.
Examples:
- Engineering
- Sales
- Finance
- HR
- Legal
- Marketing
- Operations
- Design
In this structure, employees usually report inside their function.
If a person moves from engineering to product, or from product to cloud, the reporting manager may also change.
Strength#
Functional organizations create deep specialization.
Risk#
They may create silos. Engineering may think only like engineering. Sales may think only like sales. Finance may think only like finance.
Research Example: Apple#
Apple is often discussed as a strong example of a functional organization. Instead of organizing fully around separate product business units, Apple has historically emphasized functions such as design, engineering, operations, marketing, and retail. This supports deep expertise and product integration.
The important point is not that every company should copy Apple. The point is that a functional structure can work well when expert judgment and product integration are more important than independent business-unit profit-and-loss ownership.
6. Divisional or Product-Based Organization#
In a divisional structure, the company is organized around products, regions, customer segments, or business units.
Examples:
- Cloud Business
- Consumer Business
- Enterprise Business
- India Region
- Europe Region
- Banking Customers
- Retail Customers
Strength#
Each division can focus on its own market, customer, revenue, and product strategy.
Risk#
Functions may get duplicated across divisions. Different divisions may solve similar problems separately.
Research Examples: Microsoft, Alphabet, Meta, Oracle#
Large companies often report their business through major segments. Microsoft reports through segments such as Productivity and Business Processes, Intelligent Cloud, and More Personal Computing. Alphabet reports Google Services, Google Cloud, and Other Bets. Meta reports Family of Apps and Reality Labs. Oracle reports cloud/software, hardware, and services businesses.
These financial segments are not always the same as the internal reporting chart, but they are useful evidence that large companies are often understood through business lines, product areas, or strategic divisions.
Part B: Work Structure#
Work structure answers the question:
How does actual work get done?
The formal reporting chart may show one structure, but daily work may happen differently.
7. Matrix Organization#
In a matrix organization, a person has one official reporting manager but may also receive work direction from another leader.
A larger matrix can look like this:
Types of Matrix#
| Type | Meaning |
|---|---|
| Weak matrix | Functional manager has more authority |
| Balanced matrix | Functional and project managers share authority |
| Strong matrix | Project manager has more authority over delivery |
Strength#
Matrix organizations are useful when work needs people from many functions.
Risk#
A person may receive conflicting priorities from multiple leaders.
Better Wording#
Instead of saying:
A person has multiple managers.
It is better to say:
A person usually has one formal reporting manager, but may receive work direction from project, product, program, or client leaders.
8. Project-Based Teams#
In project-based work, people come together for a specific problem, mission, product feature, client delivery, or transformation program.
A person may still have a formal manager, but daily work is organized around projects.
Strength#
Project-based teams are flexible and fast.
Risk#
If ownership is unclear, accountability becomes weak.
Important Correction#
We should not say:
No one is manager.
That is usually wrong.
A better statement is:
In project-based environments, daily collaboration may feel less hierarchy-driven, but formal managers usually still exist for performance, compensation, promotion, and accountability.
9. Network or Community-Based Collaboration#
In some organizations, work is influenced not only by reporting lines but also by expert networks, communities of practice, guilds, open-source-style collaboration, internal platforms, and informal influence.
Example:
- Data Science Community
- Architecture Council
- Security Guild
- Product Design Community
- AI Center of Excellence
Strength#
Knowledge flows faster than hierarchy.
Risk#
Influence may become invisible. People may not know who is finally accountable.
Part C: Decision Structure#
Decision structure answers the question:
Where are important decisions made?
10. Centralized Decision-Making#
In centralized decision-making, major decisions are made by a small number of senior leaders.
Strength#
Centralization gives consistency and strong direction.
Risk#
It can create bottlenecks. Teams may wait for top-level decisions.
Research Example: Apple#
Apple is often used as an example of a company with strong functional leadership and centralized product judgment. This does not mean Apple has no hierarchy or no teams. It means major product and design decisions are strongly shaped through senior functional leadership.
11. Decentralized Decision-Making#
In decentralized decision-making, teams or business units have more authority to make decisions.
Strength#
Teams can move faster.
Risk#
Different teams may move in different directions unless the organization has strong principles, architecture, and governance.
Research Example: Amazon / AWS#
Amazon and AWS are often associated with small autonomous teams, single-threaded ownership, and two-pizza team thinking. The important lesson is not only team size. The deeper idea is ownership: a team should have clear responsibility for a product, service, or customer outcome.
12. Federated Decision-Making#
Federated decision-making is a middle path.
Some decisions are centralized. Some decisions are local.
Example:
| Decision Area | Who Decides? |
|---|---|
| Company strategy | Central leadership |
| Architecture standards | Central platform or architecture group |
| Product roadmap | Product/business unit |
| Sprint execution | Local team |
| Hiring process | HR + local manager |
| Security policy | Central security team |
Strength#
Federated structures balance control and autonomy.
Risk#
They require clear decision rights. Otherwise people may fight over who has authority.
13. Flat Organization#
A flat organization has fewer management layers between senior leadership and individual contributors.
Flat does not mean manager-less.
Strength#
Communication is faster.
Risk#
As the organization grows, lack of middle leadership may create confusion, overload, and hidden hierarchy.
14. Comparing the Patterns#
| Pattern | Main Question | Best Use | Main Risk |
|---|---|---|---|
| Single-manager hierarchy | Who reports to whom? | Clarity and control | Slow decision-making |
| Functional organization | What is each person’s specialization? | Deep expertise | Silos |
| Divisional organization | Which business/product owns the outcome? | Business accountability | Duplication |
| Matrix organization | How do functions collaborate on work? | Cross-functional projects | Conflicting priorities |
| Project-based teams | How do we organize temporary work? | Flexibility and speed | Weak ownership |
| Network collaboration | How does knowledge flow? | Innovation and expertise sharing | Invisible authority |
| Centralized decisions | Who has final say? | Consistency and strong vision | Bottleneck |
| Decentralized decisions | Can teams decide locally? | Speed and ownership | Fragmentation |
| Federated decisions | What is central and what is local? | Scale with governance | Authority confusion |
| Flat organization | How many layers exist? | Speed and openness | Manager overload |
15. Company Example Table#
| Company Example | Way to Use It | What It Illustrates |
|---|---|---|
| Apple | Apple-like functional and centralized product decision model | Functional expertise and senior product judgment |
| Amazon / AWS | Amazon-like two-pizza team and single-threaded ownership model | Small autonomous teams with clear ownership |
| Microsoft | Microsoft-like business segment and product/platform organization | Large company with multiple strategic business areas |
| Alphabet / Google | Alphabet-like portfolio and segment structure | Independent businesses under a holding-company model |
| Meta | Meta-like product/platform grouping such as Family of Apps and Reality Labs | Product family and long-term bet separation |
| Oracle | Oracle-like enterprise business segmentation | Cloud/software, hardware, and services business lines |
16. Final Conclusion#
A mature organization should not be understood through only one chart.
The better questions are:
- Who is the formal manager?
- Who gives day-to-day work direction?
- Who owns the business outcome?
- Who has final decision authority?
- How wide or narrow is the span of control?
- Are decisions centralized, decentralized, or federated?
- Is the organization designed for control, expertise, speed, innovation, or scale?
The most important conclusion is this:
Real organizations are hybrids.
A company may have functional departments, product divisions, matrix execution, project-based teams, centralized strategic decisions, and decentralized local execution at the same time.
Therefore, instead of saying:
This company is a hierarchy. This company is a matrix. This company has no managers.
It is better to say:
This company uses a combination of reporting structures, work structures, and decision structures.

Comments: