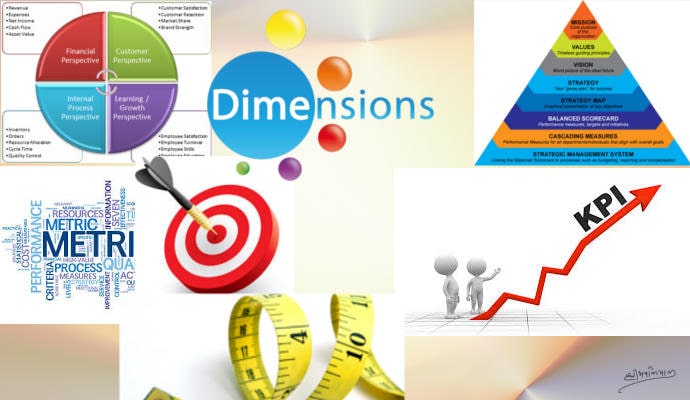
Balanced Score Card#
What is the difference between Dimension and Measures?#
In business intelligence (BI) there are two terms, Dimension, and Measures. Dimension is something which can be used for filtering, grouping purpose like department name, employee name, location, severity, priority, etc. The measure is something on which you can perform mathematical and statistical operations like average, sum, minimum, max, etc. Like salary, delay, time to solve a problem, number of tickets, travel expenses, fees, revenue, etc.
What are the Metrics?#
Everything, that can be measured will have metrics. Metrics is something that shows the status, progress, fact in terms of some number. Metrics will be calculated based on a certain formula. It has an associated unit.
For example
A- The defect density is .001/thousand units. The formula for this can be, “numbers of defects identified during the quality test” / “number of units tested”.
B- The cost variance is 7.5 %. The formula for cost variance can be, “Actual Variable cost” + “Actual Fixed Cost” / (“Planned Variable cost” + “Planned Fixed Cost”)
What is the KPI (Key Performance Indicator)?#
KPI or Key performance metrics are attached to the role or department. They are used to measure the performance of the function or a role. KPIs are nothing but metrics but all the metrics are not KPI. Only key or selected metrics are used by the senior management to know the performance, so that from time to time if required they can give advice or direction to juniors or the owners of KPIs to improve the performance.
What are the Indicators?#
KPIs are indicators. They indicate along the time how a KPI is moving up, down, or flat. Indicators tell you that against the defined goal in what direction performance is going. Indicators may be positive like sales. More the value better it is and this means it is improving and going up. Indicators may be negative also like defects. More the value bad it is and this means performance is deteriorating over time.
What is the Strategy map?#
Why the performance is going up or down? KPI does not tell you that but a strategy map can tell you. The strategy map shows the relationship between various KPIs. For example revenue (a KPI) indicates it is increasing but the reason for that may be because input MRP (a KPI) has been increased or more unit sold (a KPI), a new product launched (a KPI), quality of existing product increased (a KPI), etc. These KPIs are interrelated and mapped on a strategy map.
What is the Performance Measure?#
Every KPI has three numbers called minimum, maximum and actual. This is required to know whether KPI is within the control or not. Secondly, before it goes out of control management comes to know through the Indicators that in what direction it is going and what action plan or initiative needs to be taken. For example revenue min $ 2m from the new product line, max $5m from the new product line, and actual is $4.5m from the new product line. It indicates KPI is within control but at the same time, we are doing more research and producing a new product,s and getting lessor revenue from the established product line.
Performance measure % (Negative KPI)= (Value- Min) / (Max-Min) *100%
Performance Measure % (Positive KPI) = (Max – Val) / (Max-Min) * 100%
What is the Progress Measure?#
When KPI gets stabilized then management may focus to improve those. And for this purpose, they define a baseline, i.e. minimum performance, and they define a goal, i.e. aspire to achieve in coming time, let us say 2 month time. In this situation measure progress measure of the KPI. The progress measure of KPI is different from performance measure.
Progress Measure % = ((Value – Baseline) / (Target – Baseline)) * 100%
What is the Scorecard?#
When you read these KPIs along with objectives then it gives more meaning. To meet one objective of the organization there may be multiple KPI. The objective can vary from one department to another department and similarly KPI can also be different. When you read the Score of KPI along with the objective then you are reading the scorecard and not KPI only. For example sales department objective: Be competitive in African. And one of the KPIs they decide for this is to reduce the price (a KPI), increase sales (a KPI) from new innovating products in the African market.
What is the Balanced Scorecard?#
There are 4 perspectives of any business
- How do our customers see us?
- How do our stakeholders see us?
- How are our delivery capabilities and competencies?
- Are we learning and improving?
Every perspective can have many objectives. Every objective can have many KPIs. KPIs may be interrelated to each other.
To sustain and survive in long run it is extremely important that every organization balance between these four perspectives. In a particular financial year if you focus on any one aspect too much and ignore others then it will have a reverse impact on the survival and sustainability of the performance of the organization. Therefore to balance these 4 perspectives, top management uses a Balance Scorecard. Where they see the overall progress of the organization over the period of time and take corrective actions or initiatives in a timely manner.
What is the Dashboard?#
The dashboard is a graphical representation of multiple KPI on the screen or wall to tell you whether KPI is within the limit or not. A dashboard can show KPI information in the form of a speedometer, dialer, gauge, trend chart, etc.
Conclusion#
BSC or Balance Score Card has dedicated books and tools dedicated for this subject. But to enter into that terrain we need to have some basic understanding. I hope this article helped you in understanding the key terms related to the Balanced Score Card. Let me know your feedback. If I missed something or not able to explain something correctly then feel free to write in the comment box.

Comments: